More and more things are being made here;U.S. Census data shows manufacturing in the U.S. (and Texas) continues to rebound
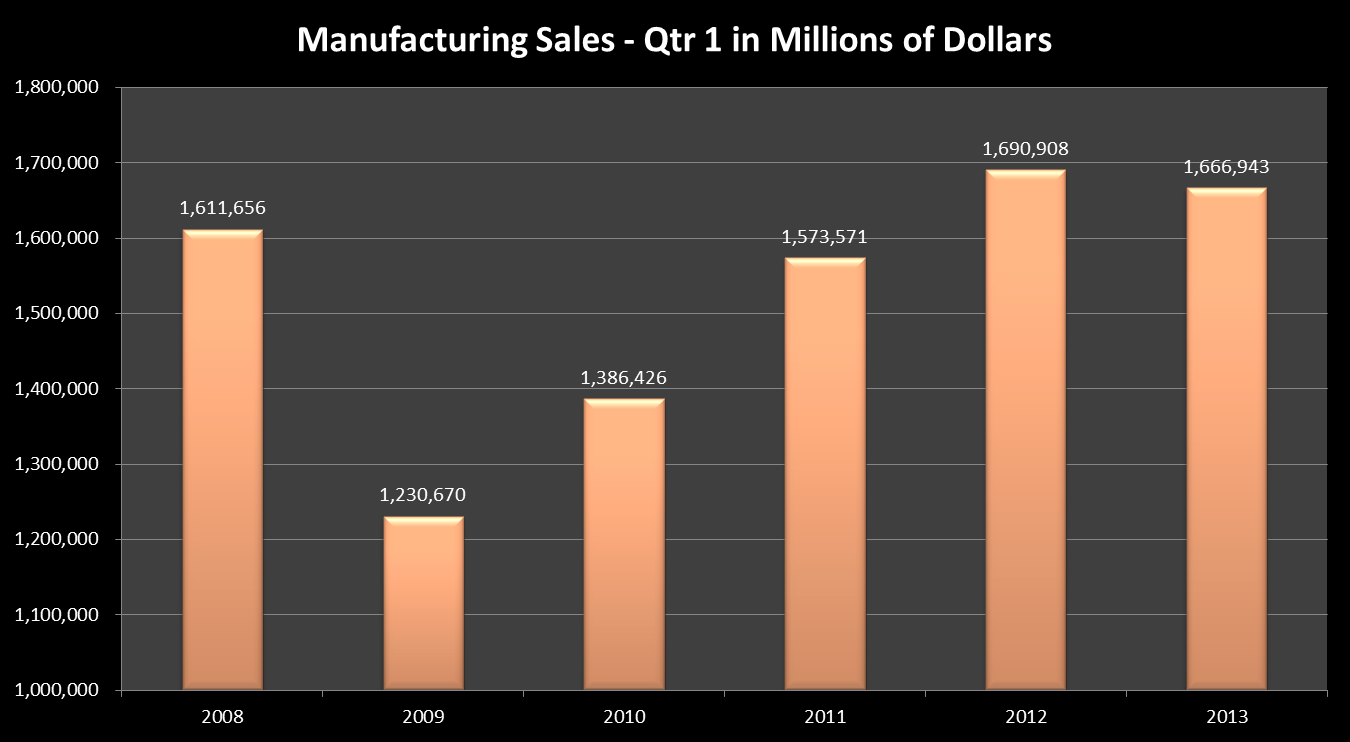
 No matter what data you look at, manufacturing in the U.S. continues to increase. Sales for all U.S. manufacturers exceeded $1.69 trillion in the 1st quarter of 2012. In comparison, 1st quarter sales of manufacturing goods had falling to about $1.2 trillion at the deepest point of the ‘great recession’ in 2009.
Manufacturing levels have reached, and slightly exceeded pre-recession economic output in nominal or non-inflation adjusted terms. Before the recession, manufacturing 1st quarter sales were at $1.6 trillion in nominal or non-inflation adjusted terms.
So where is a good source for manufacturing output information?
http://www.census.gov/econ/manufacturing.html
The U.S. Census industry portal is also a good source
http://www.census.gov/econ/isp/
Related Posts

Posted by Matt Rigling | U.S. Economy
STATA statistical code for estimation of Millimet et al. (2002) econometric worklife model
The STATA code for estimating the Millimet et a;. (2002) econometric worklife model can be found below. The code will need to be adjusted to fit your purposes. However, the […]
Posted by Matt Rigling | U.S. Economy
A narrative description of the Millimet et. al (2002) econometric worklife model
The following describes the approach used by Millimet et al (2002) to estimate U.S. worker worklife expectancy. The pdf version can be found here: Millimet (2002) Methodology Description Methodology First, transition […]
Posted by Matt Rigling | U.S. Economy
Big BLS employment data, disability, and worklife expectancy
Big Data. Bureau of Labor Statistics. Survey data. Employment Big Data. Those are all things that calculating worklife expectancy for U.S. workers requires. Worklife expectancy is similar to life expectancy and […]
Posted by Matt Rigling | BLS Data | Earnings | Industry | U.S. Economy | Wage and hour cases
FLSA OT report for individuals working in Derrick, rotary drill, and services unit operators, oil, gas, and mining occupations
In this post, we look at the weekly overtime (OT) hours typically worked by those who work in Derrick, rotary drill, and services unit operators, oil, gas, and mining occupations. Many […]
Posted by Matt Rigling | U.S. Economy
Younger workers today have slightly less attachment to the workforce than younger workers in the past
Big Data. Bureau of Labor Statistics. Survey data. Employment Big Data. Those are all things that calculating worklife expectancy for U.S. workers requires. Worklife expectancy is similar to life expectancy and […]
Posted by Matt Rigling | BLS Data | Job openings | U.S. Economy
Elementary and Middle School Teachers experienced the largest increase of job openings nationwide for Dec
Elementary and Middle School teachers experienced the largest increase of new openings of all occupations in the US for the month of December with 4,017 new job openings. Month Occupation […]
Posted by Matt Rigling | U.S. Economy
Replication of the Millimet et al. (2002) work was sufficient and yielded similar results
Big Data. Bureau of Labor Statistics. Survey data. Employment Big Data. Those are all things that calculating worklife expectancy for U.S. workers requires. Worklife expectancy is similar to life expectancy and […]
Posted by Matt Rigling | BLS Data | Job openings | U.S. Economy
Tallahassee, FL experienced largest increase in job openings of all US MSAs for Dec
The Tallahassee, FL MSA (metropolitan statistical area) experienced the largest increase of job openings of all MSAs in the United States for the month of December with 155 new openings. Month MSA Total […]
Posted by Matt Rigling | BLS Data | Earnings | Industry | U.S. Economy | Wage and hour cases
FLSA OT report for individuals working in roofing occupations
In this post, we look at the weekly overtime (OT) hours typically worked by those who work in roofing occupations. Many of the employees that work in these jobs are not exempt […]
Posted by Matt Rigling | U.S. Economy
Steward and Gaylor (2015) Matched CPS Sample Sizes for 1993-2013 time period
Big Data. Bureau of Labor Statistics. Survey data. Employment Big Data. Those are all things that calculating worklife expectancy for U.S. workers requires. Worklife expectancy is similar to life expectancy and […]

